Difference between revisions of "2024 DOCK tutorial 3 with PDBID 1Y0X"
Stonybrook (talk | contribs) (→Footprint Analysis) |
Stonybrook (talk | contribs) (→Footprint Analysis) |
||
| Line 261: | Line 261: | ||
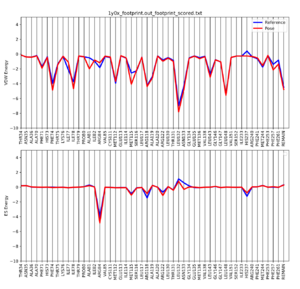
Once the script is completed you will see a .pdf file in your directory. scp this file back to your local computer. The file contains two plots that shows the energetic signature for the 50 most significant residues and will look similar to: | Once the script is completed you will see a .pdf file in your directory. scp this file back to your local computer. The file contains two plots that shows the energetic signature for the 50 most significant residues and will look similar to: | ||
| − | [[File:1y0x footprint.png|center]] | + | [[File:1y0x footprint.png|thumb|center]] |
=DOCK= | =DOCK= | ||
Revision as of 00:05, 18 March 2024
Contents
- 1 Introduction
- 2 Preparation of the ligand and protein
- 3 Creating the Protein Binding Site Surface
- 4 Box and Grid Generation
- 5 Energy Minimization
- 6 DOCK
- 7 Virtual Screening of a Ligand Library
- 8 Cartesian Minimization of Virtually Screened Small Molecules
- 9 Rescoring and Ranking Virtually Screened Molecules
Introduction
- Setting up your environment
- Downloading a protein from the PDB database
- Determining if there are any missing loops in the structure and if they need to be modeled
- Preparing the ligand
- Preparing the protein
- Finding the binding site of the protein
Learning Objectives
Setting Up Your Environment
Downloading a protein from the PDB database
Preparation of the ligand and protein
- Evaluate the structure to determine if there are any missing loops
- Prepare the protein structure
- Prepare the ligand structure
Evaluating the Structure
- Select an atom at near the start of the missing section (hold the ctrl button while clicking it)
- Select another atom near the binding site (hold ctrl + shift while clicking the second atom)
- Go to Tools → Structure Analysis → Distances
Preparing the Protein file
- Select an atom on the protein
- Press the up arrow until the entire protein is selected
- Go to Select → Invert (all models). This will change the selection from the protein to everything else in the structure
- Go to Actions → Atoms/Bonds → Delete
- Save the structure with a new file name (i.e. 4s0v_protein_only.pdb). Your pdb file will now look similar to this:
- Adding hydrogens
- Adding charge
- Click on one atom anywhere on the protein
- Click on Select → Zone. This will cause the following dialogue box to appear:
Preparing the Ligand File
- Select an atom on the ligand
- Press the up arrow until the entire ligand is selected (you may have to press the up arrow many times)
- Go to Select → Invert (all models). This will change the selection from the ligand to everything else in the structure
- Go to Actions → Atom/Bonds → Delete
- Save the structure with a new file name (i.e. 4s0v_ligand_only.pdb). The image will look similar to this:
- Add hydrogens
- Add charges
Final Steps
Creating the Protein Binding Site Surface
Creating the Required Surface (DMS) File
Generating Spheres for the Binding Site
Binding Site Spheres
- scp selected_spheres.sph to your local computer
- Close any open sessions you have in Chimera
- In Chimera open selected_spheres.sph
- In the current session, open the original protein/ligand complex (4s0v.pdb)
- You should see the spheres located within the binding site of the protein, similar to:
- Hold down ctrl and click on a sphere
- Press the up arrow until all spheres are selected
- Actions → Atoms/Bonds → hide
- Verify the ligand is where the spheres were
Box and Grid Generation
The next step in the docking process is to generate energy interactions between the atoms of the protein and ligand. If this was done for the whole complex it would take too long to run to be useful. To get around this computationally expensive step, dock uses a box/grid method. We will define a box around the area of interest for the protein/ligand and DOCK will generate a grid within this box which will be used in the energy calculations.
Generating the Box
To generate the box we will be working again on the command line using a DOCK program called showbox. Start by logging into Seawulf and navigating to your 003.gridbox directory. We need to make a new file called showbox.in by typing:
vi showbox.in
This will create a new file, with a filename of showbox.in and open it in vi. The following commands need to be typed:
     Y
     8.0
     ../002.surface_spheres/selected_spheres.sph
     1
     1y0x.box.pdb
Remember to change the last line to be a filename with the number of protein you are working with. The second line of this code (8.0) is telling dock how many angstroms from the selected spheres to draw the box. Depending on your system you may need to modify this number.
To run this file, simply type:
showbox < showbox.in
If showbox was successful the file 1y0x.box.pdb will now be in your directory.
Generating the Grid
Now that we have our box defined we need to instruct DOCK to generate the grid within it. We do this using a DOCK program called grid:
vi grid.in
This command will generate and open a file named grid.in. The commands to be typed into this file are:
  allow_non_integral_charges                no
  compute_grids                             yes
  grid_spacing                              0.4
  output_molecule                           no
  contact_score                             no
  energy_score                              yes
  energy_cutoff_distance                    9999
  atom_model                                a
  attractive_exponent                       6
  repulsive_exponent                        9
  distance_dielectric                       yes
  dielectric_factor                         4.
  bump_filter                               yes
  bump_overlap                              0.75
  receptor_file                              ../001.structure/protein_final.mol2
  box_file                                  1y0x.box.pdb
  vdw_definition_file                       /gpfs/projects/AMS536/zzz.programs/dock6.10/parameters/vdw_AMBER_parm99.defn
  score_grid_prefix                         grid
The only change you need to make to the above commands is the receptor_file and box_file to reflect the files you previously generated.
Once this file is saved, run it:
grid -i grid.in -o 1y0xGridInfo.out
Be patient, this step might take a few minutes to run. You will know it's worked successfully if you see:
- grid.bmp
- grid.nrg
- 1y0xGridInfo.out
in your directory. With the box and grid successfully generated we are ready to move onto the energy minimization step.
Energy Minimization
At its core, DOCK is finding interactions between a protein and ligand by looking at energy interactions between atoms. In order for DOCK to give the most accurate results we need to ensure that the ligand is at its lowest energy state before docking it into the binding site of the protein.
Ligand Minimization
For this section we will be working in the 004.energy_min directory and will be using the dock6 command. Again we need to generate the input file that dock6 needs:
vim min.in
Once in vim the following lines need to be typed in:
 conformer_search_type                                        rigid
 use_internal_energy                                          yes
 internal_energy_rep_exp                                      12
 internal_energy_cutoff                                       100.0
 ligand_atom_file                                             ../001.structure/ligand_final.mol2
 limit_max_ligands                                            no
 skip_molecule                                                no
 read_mol_solvation                                           no
 calculate_rmsd                                               yes
 use_rmsd_reference_mol                                       yes
 rmsd_reference_filename                                      ../001.structure/protein_final.mol2
 use_database_filter                                          no
 orient_ligand                                                no
 bump_filter                                                  no
 score_molecules                                              yes
 contact_score_primary                                        no
 grid_score_primary                                           yes
 grid_score_rep_rad_scale                                     1
 grid_score_vdw_scale                                         1
 grid_score_es_scale                                          1
 grid_score_grid_prefix                                       ../003.gridbox/grid
 minimize_ligand                                              yes
 simplex_max_iterations                                       1000
 simplex_tors_premin_iterations                               0
 simplex_max_cycles                                           1
 simplex_score_converge                                       0.1
 simplex_cycle_converge                                       1.0
 simplex_trans_step                                           1.0
 simplex_rot_step                                             0.1
 simplex_tors_step                                            10.0
 simplex_random_seed                                          0
 simplex_restraint_min                                        yes
 simplex_coefficient_restraint                                10.0
 atom_model                                                   all
 vdw_defn_file                                                /gpfs/projects/AMS536/zzz.programs/dock6.10/parameters/vdw_AMBER_parm99.defn
 flex_defn_file                                               /gpfs/projects/AMS536/zzz.programs/dock6.10/parameters/flex.defn
 flex_drive_file                                              /gpfs/projects/AMS536/zzz.programs/dock6.10/parameters/flex_drive.tbl
 ligand_outfile_prefix                                        1y0x.lig.min
 write_orientations                                           no
 num_scored_conformers                                        1
 rank_ligands                                                 no
And the file is run with the following command:
dock6 -i min.in -o min.out
After successful completion of the program two new files will be in your directory:
- min.out
- 1y0x.lig.min.mol2
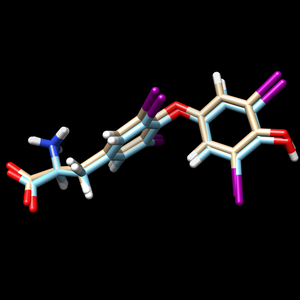
scp the .mol2 file back to your local computer. To view the changes that dock made to the structure, and open the 1y0x.lig.min.mol2 file in Chimera and in the same session, open the ligand_final.pdb file. Remember the ligand_final.pdb is the file we saved after making the protonation changes to the ligand. You should see something similar to:
The 1y0x.ligand from PDB with hydrogen and charges is cyan and the newly generated and energy minimized 1y0x.lig.min.mol2 is tint
Footprint Analysis
At its core, DOCK can be thought of as a program which evaluates, minimizes, and uses the electrostatic and VDW interactions between the ligand and protein to determine how they bind to each other. A footprint analysis is a way to visualize these interactions and possibly be used to design new ligands with the same, or better, set of energetics. The steps in this section will be done on Seawulf in the 005.footprint directory. We will be using the dock6 command and again need to create an input file:
vi footprint.in
The following lines needed to be typed into the newly created file:
 conformer_search_type                                        rigid
 use_internal_energy                                          no
 ligand_atom_file                                             ../004.energy_min/1y0x.lig.min_scored.mol2
 limit_max_ligands                                            no
 skip_molecule                                                no
 read_mol_solvation                                           no
 calculate_rmsd                                               no
 use_database_filter                                          no
 orient_ligand                                                no
 bump_filter                                                  no
 score_molecules                                              yes
 contact_score_primary                                        no
 grid_score_primary                                           no
 multigrid_score_primary                                      no
 dock3.5_score_primary                                        no
 continuous_score_primary                                     no
 footprint_similarity_score_primary                           yes
 fps_score_use_footprint_reference_mol2                       yes
 fps_score_footprint_reference_mol2_filename                  ../001.structure/ligand_final.mol2
 fps_score_foot_compare_type                                  Euclidean
 fps_score_normalize_foot                                     no
 fps_score_foot_comp_all_residue                              yes
 fps_score_receptor_filename                                  ../001.structure/protein_final.mol2
 fps_score_vdw_att_exp                                        6
 fps_score_vdw_rep_exp                                        9
 fps_score_vdw_rep_rad_scale                                  1
 fps_score_use_distance_dependent_dielectric                  yes
 fps_score_dielectric                                         4.0
 fps_score_vdw_fp_scale                                       1
 fps_score_es_fp_scale                                        1
 fps_score_hb_fp_scale                                        0
 minimize_ligand                                              no
 atom_model                                                   all
 vdw_defn_file                                                /gpfs/projects/AMS536/zzz.programs/dock6.10/parameters/vdw_AMBER_parm99.defn
 flex_defn_file                                               /gpfs/projects/AMS536/zzz.programs/dock6.10/parameters/flex.defn
 flex_drive_file                                              /gpfs/projects/AMS536/zzz.programs/dock6.10/parameters/flex_drive.tbl
 ligand_outfile_prefix                                        1y0x_footprint.out
 write_footprints                                             yes
 write_hbonds                                                 yes
 write_orientations                                           no
 num_scored_conformers                                        1
 rank_ligands                                                 no
to generate the footprint of the ligand/protein interaction type:
dock6 -i footprint.in
Again, you will know the program successfully ran if the following three files are now in your directory:
- 1y0x_footprint.out_footprint_scored.txt
- 1y0x_footprint.out_hbond_scored.txt
- 1y0x_footprint.out_scored.mol2
In order to view/analyze these results we need to use a python script that is located in the class directory. Copy it over to your 005.footprint directory with the following command:
cp /gpfs/projects/AMS536/zzz.programs/plot_footprint_single_magnitude.py .
To run this script, first we load the python using:
module load py/2.7.15
Then, type:
python plot_footprint_single_magnitude.py 1y0x_footprint.out_footprint_scored.txt 50
Once the script is completed you will see a .pdf file in your directory. scp this file back to your local computer. The file contains two plots that shows the energetic signature for the 50 most significant residues and will look similar to:

