2008 DOCK tutorial with 1LAH
For additional Rizzo Lab tutorials see DOCK Tutorials.
Contents
- 1 About DOCK
- 2 Setup DOCK in your PATH
- 3 Docking in Ornithine-binding periplasmic protein and Ornithine (1LAH)
- 4 Receptor Preparation with Chimera
- 5 Ligand Preparation in Chimera
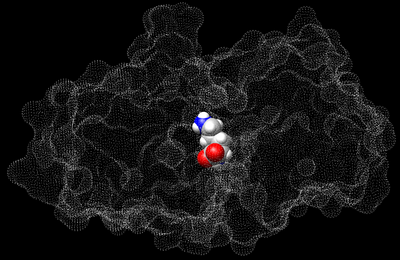
- 6 Generating the Receptor Molecular Surface
- 7 Generate Spheres
- 8 Generate Grid
- 9 Visualize the grid positioning (Optional)
- 10 Perform Docking
About DOCK
DOCK was developed by Irwin D. "Tack" Kuntz, Jr., PhD and colleagues at UCSF. Please see the webpage at UCSF DOCK.
DOCK is a molecular docking program used in drug discovery. This program, given a protein active site and a small molecule, tries to predict the correct binding mode of the small molecule in the active site, and the associated binding energy. Small molecules with highly favorable binding energies could be new drug leads. This makes DOCK a valuable drug discovery tool. DOCK is typically used to screen massive libraries of millions of compounds against a protein to isolate potential drug leads. These leads are then further studied, and could eventually result in a new, marketable drug.
Programs central to DOCK include:
SPHERGEN - this is a program which
GRID - this is a
DOCK- this program is used
Setup DOCK in your PATH
- Update your .cshrc (or equivalent) file in your home directory include the path to DOCK bin directory.
Sample commands
 cd
 vi .cshrc
Add the following lines anywhere in your .cshrc file
 ### DOCK ###
 set path = ( $path     $AMS536/dock6/bin)
To make sure the update path is being used, type
source .cshrc
Docking in Ornithine-binding periplasmic protein and Ornithine (1LAH)
Go to the RCSB Protein Databank and search for Gleevec. You should find the PDB code 1LAH named "Lysine-arginine-ornithine-binding periplasmic protein".
If not, use the link http://www.rcsb.org/pdb/explore.do?structureId=1LAH
Select Download Files in the left window pane. Select "Biological Unit gz". This will give you the biological unit file compressed with gzip. If you can not find it, use the link http://www.rcsb.org/pdb/files/1lah.pdb1.gz
Download the gzip file and locate it on your desktop. Uncompress the file with the command
gzip -d 1LAH.pdb1.gz
Alternatively, use in chimera use, File > Fetch by ID and type in 1lah.
Receptor Preparation with Chimera
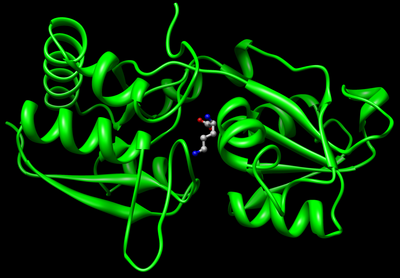
Open the file 1lah.pdb1 with Chimera. Examine the PDB file, observe the binding site and the ligand bound to it.
Now select and delete the ligand Ornithine from the complex.
Go to Actions -> Atoms/Bonds -> Delete to delete the ligand molecule.
Now go to Tools->Structure Editing->Dock Prep. This starts the DockPrep module of Chimera. During DockPrep, it will ask for the histidine protonation. In this select 'Unspecified determined by method'.
After DockPrep has run, save the charged receptor file in the .mol2 format (say 'receptor_charged.mol2). (Go to -> File|Save Mol2)
In order to generate the molecular surface of the receptor, one has to use the 'dms' program. For this the Hydrogens of the receptor needs to be removed.
(Select| Chemistry |Element | H and then Actions| Atoms/Bonds |delete
Now save the mutated receptor in .pdb format (say receptor_noH.pdb). (Go to -> File|Save PDB)
For more details about DockPrep, use http://www.cgl.ucsf.edu/chimera/1.2199/docs/ContributedSoftware/dockprep/dockprep.html
Ligand Preparation in Chimera
Now delete the receptor to get only the ligand. (Select| Structure | Ligand. --> Select | Invert all models --> Actions |Atoms/Bonds |Delete)
To prepare the ligand, select the ligand and add hydrogen and charge using Tools | Structure Editing |Add H and similarly Add Charges. Choose the am1-bcc charge model that is selected by default.
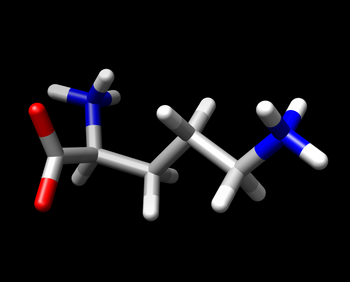
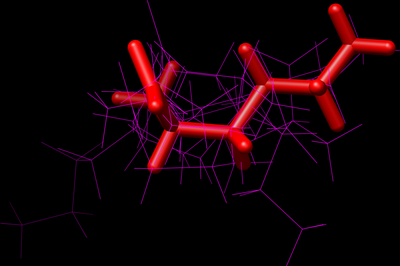
Verify that the hydrogens have been added correctly as in the diagram on the right.
Save the molecule in .mol2 format as 'ligand_charged.mol2'. (File > Save as Mol2 in Chimera)
Generating the Receptor Molecular Surface
This is done by using the 'dms' program and the mutated receptor file with hydrogens stripped off.
dms receptor_noH.pdb -n -w 1.4 -v -o receptor.ms
The options associated with the dms program are
-a  	use all atoms, not just amino acids
-d 	change density of points
-g 	send messages to file
-i 	calculate only surface for specified atoms
-n 	calculate normals for surface points
-w 	change probe radius
-v 	verbose
-o 	specify output file name (required)
Generate Spheres
1. Run sphgen on the command line using the sample input file called INSPH.
Open the link INSPH and use it to create a file called INSPH. You can use the vi editor to do this. Alternatively, you can use the command 'cat > INSPH' at the shell prompt and paste the contents of INSPH. Use Ctrl-D to save and close the file.
If the output file OUTSPH or receptor.sph or any of the temp files (temp1.ms, temp2.sph or temp3.atc) exist, a core dump will occur and sphgen will fail. Delete all these files and before running sphgen.
SPHGEN takes a few minutes to run. It may take longer for larger proteins. This produces spheres for the entire protein.
sphgen -i INSPH -o OUTSPH
Here is a sample output OUTSPH file.
density type = X
reading  receptor.ms                                                                        type   R
# of atoms =   1814   # of surf pts =  54940
finding spheres for   receptor.ms
dotlim =     0.000
radmax =    4.000
Minimum radius of acceptable spheres?
 1.39999998
output to  receptor.sph
clustering is complete     29  clusters
2. Select spheres in the proximity of the binding site:
sphgen produces spheres on the whole protein. But we only want to retain spheres which are in the binding site for docking. sphere_selector takes as input receptor.sph which that was generated by sphgen, a .mol2 file specifying the ligand binding site and the distance (in angstroms) from the ligand.
sphere_selector receptor.sph ligand_charged.mol2 10.0
3. Convert spheres to PDB format using showsphere program so we can visualize the spheres in the context of the receptor and the original ligand
showsphere showsph.in
The file selected_spheres.pdb (as defined in showsph.in) is generated after running showsphere. Based on the showsph.in file, this will generate a pdb file selected_spheres.pdb.
4. Visualize spheres (Optional)
This section will use command line mode of Chimera the view the spheres we just created. After starting Chimera, use Tools->General Controls->Command Line Adjust the side view to get entire protein in view (Tools->Viewing Controls->Side View)
open selected_spheres.pdb
open receptor_charged.mol2
open ligand_charged.mol2
surface #2
~disp #2
surftrans 80 #0
This will open the spheres, receptor and ligand and turns on the surface display and turns off the atom/bond display.
- Now select the spheres and display them as ball-and-line.
- Select the ligand and display as stick.
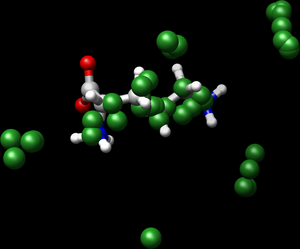
You will now be able to see how the selected spheres are placed close to the ligand defining the binding site.
Generate Grid
Generate grid box.
showbox < showbox.in
Generate grid
grid -i grid.in
The grid computation creates an energy grid grid.nrg and a bump grid grid.bmp. This computation should take about a minute to finish.
The attribute 'grid_spacing' in the grid.in file controls the fineness of the energy grid generated. In this tutorial, it is set to 0.5A so that the grid calculation finishes quickly. However, for actual docking experiments, we would use a finer grid with a smaller spacing of 0.3A.
The 'attractive_exponent' and 'repulsive_exponent' determine the Van der Waals exponents used. In this tutorial, we are using 6-9 grids. This makes the repulsive component of VDW weaker than the usual 6-12 vdw, and often produces better docking results.
If you need to run grid again, please ensure that grid.bmp and grid.nrg files are removed before proceeding.
Visualize the grid positioning (Optional)
- Start chimera. Open the receptor, spheres from sphgen and the box from showbox.
- In Chimera, select
- File->Open-> and select your receptor molecule (ie receptor_charged.mol2)
- File->Open-> and select your box (ie rec_box.pdb)
- File->Open-> and select your spheres (i.e. selected_spheres.pdb)
- Make the receptor a surface representation.
- Select->Chain->A
- Action->Surface->Show
- Action->Atoms/Bonds->Hide
- Select your grid box and make the lines thicker.
- Select->Residue->Box
- Actions->Atoms/Bonds->Wire Width->4
- Increase size of the selected spheres.
- Select->Chain->(No id)->Selected Spheres
- Action->Atoms/Bonds->Ball+Stick
- Tools->General Controls->Model Panel
- Select the selected_spheres model by clicking once on the name.
- Select the 'Attributes' button on the right. Set the ball scale to .5.
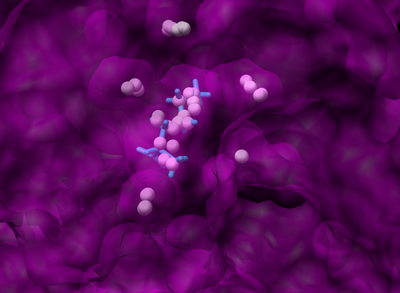
The following figure shows the surface representation of the receptor molecule in transparent grey. The spheres that occupy the nooks and crannies represent potential sites that heavy atom molecules can potentially occupy. This is a much more enclosed binding site and the surface was made transparent so that the binding site is visible.
Alternatively, you can also run the following commands in command line mode to perform all the steps described above.
open receptor_charged.mol2
open rec_box.pdb
open selected_spheres.pdb
surface #0
~disp #0
linewidth 4 #1
repr bs #2
setattr ballScale .5 #2
Perform Docking
There are two kinds of docking options : Rigid Ligand Docking and Flexible Ligand Docking.
For Rigid Ligand Docking the ligand is held rigid during orientation.
dock6 -i rigid.in -o rigid.out
This generates the following files:
rigid.out which gives a summary of the run
output_scored.mol2 which gives the MOL2 file containing the geometric coordinates as well as the summary of interaction energies of binding for the docked ligand poses in the order of their grid score. The best pose would have the most favourable grid score. The following shows a sample view of the details of interaction energies generated in the mol2 file.
########## Name:                1lah
########## RMSD:                0.373891
########## Cluster Size:        33
########## Grid Score:          -71.115257
##########          vdw:          -32.781906
##########           es:          -38.333351
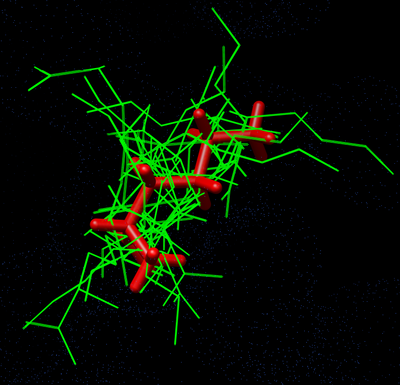
To visualize the docking result, open rigid_scored.mol2 in Chimera and simultaneously load the receptor.pdb and ligand_charged.mol2 files.
For Flexible Ligand Docking, the ligand is allowed to be flexible by applying an 'anchor and grow' algorithm.
dock6 -i flex.in -o flex.out
This generates the following files:
flex.out giving the summary of the run (change the name of output file to 'flex' instead of 'OUTPUT' in flex.in).
flex_scored.mol2 which gives the geometric coordinates and the summary of the interaction energies of binding for the docked ligand poses in order of their grid score.
########## Name:                1lah
########## RMSD:                1.04985
########## Grid Score:          -71.792480
##########          vdw:          -32.469391
##########           es:          -39.323093
