2013 DOCK tutorial with Orotodine Monophosphate Decarboxylase
For additional Rizzo Lab tutorials see DOCK Tutorials. Use this link Wiki Formatting as a reference for editing the wiki. This tutorial was developed collaboratively by the AMS 536 class of 2013, using DOCK v6.6.
Contents
I. Introduction
DOCK
DOCK is a molecular docking program used in drug discovery. It was developed by Irwin D. Kuntz, Jr. and colleagues at UCSF (see UCSF DOCK). This program, given a protein binding site and a small molecule, tries to predict the correct binding mode of the small molecule in the binding site, and the associated binding energy. Small molecules with highly favorable binding energies could be new drug leads. This makes DOCK a valuable drug discovery tool. DOCK is typically used to screen massive libraries of millions of compounds against a protein to isolate potential drug leads. These leads are then further studied, and could eventually result in a new, marketable drug. DOCK works well as a screening procedure for generating leads, but is not currently as useful for optimization of those leads.
DOCK 6 uses an incremental construction algorithm called anchor and grow. It is described by a three-step process:
- Rigid portion of ligand (anchor) is docked by geometric methods.
- Non-rigid segments added in layers; energy minimized.
- The resulting configurations are 'pruned' and energy re-minimized, yielding the docked configurations.
Orotodine Monophosphate Decarboxylase
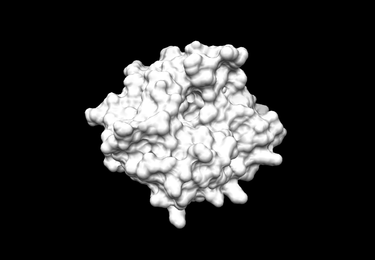
The protein receptor which is the subject of this tutorial is orotodine monophosphate decarboxylase (OMP), a homodimeric protein from the organism Methanobacterium thermoautotrophicum. OMP is involved in the biosynthesis of several pyrimidines including uridine monophosphate (UMP), the ligand used in this tutorial. UMP is a pyrimidine-based nucleotide monomer of RNA. The structure used for this tutorial can be found at the Protein Data Bank under accenssion number 1LOQ.
Organizing Directories
While performing docking, it is convenient to adopt a standard directory structure / naming scheme, so that files are easy to find / identify. For this tutorial, we will use something similar to the following:
~username/AMS536/dock-tutorial/00.files/
                              /01.dockprep/
                              /02.surface-sphgen/
                              /03.box-grid/
                              /04.dock/
                              /05.mini-virtual-screen/
                              /06.database-filter/
                              /07.virtual-screen/
In addition, most of the important files that are derived from the original crystal structure will be given a prefix that is the same as the PDB code, '1LOQ'. The following sections in this tutorial will adhere to this directory structure / naming scheme.
II. Preparing the Receptor and Ligand
Downloading the PDB file (1LOQ)
Go to PDB homepage (http://www.rcsb.org/pdb/home/home.do ) enter the protein ID (1LOQ) in the search bar, click Download Files in the top-right of the webpage, then select PDB File (text). In the new window, save the file in Downloads.
Preparing the ligand and receptor in Chimera
In this section, we will create four new files and save them in the 00.files/ folder:
 1LOQ.dockprep.mol2      (complete system with hydrogens and charges)
 1LOQ.receptor.mol2      (the receptor alone)
 1LOQ.receptor.noH.mol2  (the receptor alone, without hydrogens)
 1LOQ.ligand.mol2        (the ligand alone)
To prepare these files, first copy the original PDB file into the 00.files/ folder and open it with VIM ($ vim 1LOQ.pdb). Because the residue name of the ligand (U) will give us some problems when assigning charges, change the residue name "U" to "LIG" starting at line 2082. Here is an example command that will change all instances of " U" into "LIG", while preserving the correct spacing:
%s/ U/LIG/gc
For this command, g is short for global and c is short for check with the user before making the change.
Next, open up the PDB file (1LOQ.pdb) in Chimera. To delete water molecules and other ligands, click Tools -> Structure Editing -> Dock Prep. Check all boxes and click Okay to the end. Alternatively, the waters can be deleted manually by choosing Select -> Residue -> HOH, then go to Actions -> Atoms/Bonds -> Delete. Hydrogen atoms can be added manually by choosing Tools -> Structure Editing -> Add H.
Next, to add charges to the ligand and receptor, go to Select -> Residue -> LIG, then go to Tools -> Structure Editing -> Add Charge. Choose AMBER ff99SB as the charge model, click Okay, and when prompted chose AM1-BCC charges for the ligand, and make sure the Net Charge is set to -1. (You must consider the chemistry of the ligand when assigning a charge state).
Finally, save this file as 1LOQ.dockprep.mol2.
Generating the final files
To create the receptor file: Open 1LOQ.dockprep.mol2, click Select -> Residue -> LIG. Then click Actions -> Atoms/Bonds -> Delete. Save the file as 1LOQ.receptor.mol2.
To create the receptor file with no hydrogen atoms: Open 1LOQ.dockprep.mol2, click Select -> Chemistry -> Element -> H, then chose Actions -> Atoms/Bonds -> Delete. Save the file as 1LOQ.receptor.noH.mol2.
To create the ligand file: Open 1LOQ.dockprep.mol2, click Select -> Residue -> LIG, then click Select -> Invert, then chose Actions -> Atoms/Bonds -> Delete. Save the file as 1LOQ.ligand.mol2.
III. Generating Receptor Surface and Spheres
Receptor Surface
In order to generate the receptor surface one can perform the following steps (working in Chimera):
- Go File -> Open and choose the PDB file of the protein containing no hydrogens (1LOQ.receptor.noH.pdb)
- Further, Actions -> Surface -> Show
- Go Tools -> Structure Editing -> Write DMS in order to obtain a dms file, which we will need while placing spheres
- In the new window save the surface as 1LOQ.receptor.dms
Placing Spheres
In order to place the spheres on the receptor surface, the following steps are required:
1. Create a file called INSPH (an input file we will need later) and fill it out as follows (parameter descriptions included to the right), then save it.
1LOQ.receptor.dms            #molecular surface file that we got from previous step
R                            #sphere outside of surface (R) or inside surface (L)
X                            #specifies subset of surface points to be used (X=all points)
0.0                          #prevents generation of large spheres with close surface contacts(defalut=0.0)
4.0                          #maximum sphere radius in angstroms (default=4.0)
1.4                          #minimum sphere radius in angstroms (default=radius of probe)
1LOQ.receptor.sph            #clustered spheres file that we want to generate
Make sure that your file doesn't contain any blank lines or the comments (denoted by # ) from above, otherwise it won't work.
2. Run the sphgen program from the command line:
sphgen -i INSPH -o OUTSPH
OUTSPH is the output file containing the information on the sphgen run, while 1LOQ.receptor.sph is the file which contains the spheres.
3. (optional) If one wants to have a look at the spheres received as an outcome of sphgen, one should run showsphere, by typing in the commandline:
showsphere
The following questions will be prompted on the command line:
Enter name of sphere cluster file:
Enter cluster number to process (<0 = all):
Generate surfaces as well as pdb files (<N>/Y)?
Enter name for output file prefix:
Process cluster 0 (contains ALL spheres) (<N>/Y)?
As the questions have been answered the program will generate the spheres, writing the data in a PDB file, afterwards the spheres may be observed by opening this file in Chimera.
4. Run the sphere_selector program from the command line as follows:
sphere_selector 1LOQ.receptor.sph ../01-dockprep/1LOQ.ligand.mol2 8.0
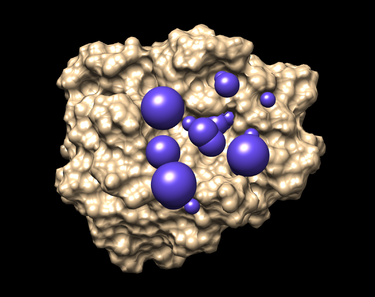
This program selects the spheres within a user-defined radius (8.0 here) of a target molecule from the previously obtained file 1LOQ.receptor.sph. As a result a new file selected_spheres.sph will be generated. Again, the spheres can and should be visualized by using showsphere and Chimera.
5. Run showsphere in order to visualize the spheres:
showsphere
When prompted on the command line, answering the questions as follows:
selected_spheres.sph
-1
N
output_spheres_selected
N
- Launch Chimera, choose File -> Open, choose 1LOQ.receptor.noH.pdb
- Go File -> Open, choosing output_spheres_selected.pdb
- Go Select -> Residue -> SPH
- Finally, Actions -> Atoms/Bonds -> sphere
The picture like one placed below will be obtained afterwards.
IV. Generating Box and Grid
Box
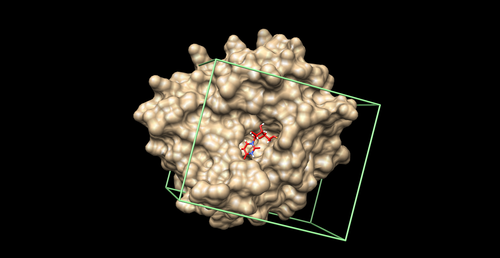
We will create a box around the binding site to define the boundaries of ligand sampling and aid in energy calculations. As a general rule, we will create a box around the spheres (from the previous step) with margins of at least 8.0 Angstroms on all sides.
First create a directory where you put all your grid and box files:
mkdir 03.box.grid
cd 03.box.grid
Then you need to create a showbox.in file to generate the box:
vim showbox.in
Edit this file as following:
 Y                                           # generate box?
 8.0                                         # box margin
 ../02.surface-sphgen/selected_spheres.sph   # input sphere files
 1                                           # which sphere cluster to use
 1LOQ.box.pdb                                # output file name
Note: Do not include the comments in the showbox.in file. To run the program showbox, give the name on the command line and provide the showbox.in file:
showbox < showbox.in
Grid
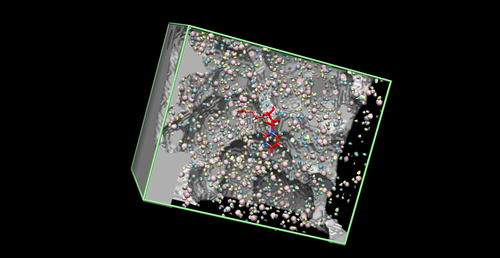
Grids are used as a method to speed up evaluation of the energy scoring function by pre-computing electrostatic and VDW potential energies on the receptor at defined grid points within the box.
Use grid program to generate the grid and answer the questions as following:
grid -i grid.in
compute_grids                  yes
grid_spacing                   0.4
output_molecule                no
contact_score                  no
energy_score                   yes
energy_cutoff_distance         9999
atom_model                     a
attractive_exponent            6
repulsive_exponent             9
distance_dielectric            yes
dielectric_factor              4
bump_filter                    yes
bump_overlap                   0.75
receptor_file                  ../01.dockprep/1LOQ.receptor.mol2
box_file                       ../03.box.grid/1LOQ.box.pdb
vdw_definition_file            ../00.files/vdw_AMBER_parm99.defn
score_grid_prefix              1LOQ.grid
V. Docking a Single Molecule for Pose Reproduction
Create the input file for docking:
touch dock.in
Execute Dock6:
dock6 -i dock.in
This will generate the questions to set the parameters. As an example, for the rigid body docking the parameters will be as follows:
ligand_atom_file                                             ../01.dockprep/1LOQ.ligand.mol2
limit_max_ligands                                            no
skip_molecule                                                no
read_mol_solvation                                           no
calculate_rmsd                                               no
use_database_filter                                          no
orient_ligand                                                no
use_internal_energy                                          no
flexible_ligand                                              no
bump_filter                                                  no
score_molecules                                              yes
contact_score_primary                                        no
contact_score_secondary                                      no
grid_score_primary                                           yes
grid_score_secondary                                         no
grid_score_rep_rad_scale                                     1
grid_score_vdw_scale                                         1
grid_score_es_scale                                          1
grid_score_grid_prefix                                       ../03.box-grid/1LOQ.grid
multigrid_score_secondary                                    no
dock3.5_score_secondary                                      no
continuous_score_secondary                                   no
descriptor_score_secondary                                   no
gbsa_zou_score_secondary                                     no
gbsa_hawkins_score_secondary                                 no
SASA_descriptor_score_secondary                              no
amber_score_secondary                                        no
minimize_ligand                                              no
atom_model                                                   all
vdw_defn_file                                                ../00.files/vdw_AMBER_parm99.defn
flex_defn_file                                               ../00.files/flex.defn
flex_drive_file                                              ../00.files/flex_drive.tbl
ligand_outfile_prefix                                        output
write_orientations                                           no
num_scored_conformers                                        1
rank_ligands                                                 no
The rigid docking will result in a single-ligand pose. Open Chimera to visualize the docking result. After opening the receptor file in surface view, open the ligand file (named "output_scored.mol2") by going under "Tools--> Surface/Binding Analysis--> ViewDock".
For flexible docking, change input parameters. These changes will generate additional questions. Some changes to parameters are shown below:
calculate_rmsd                                               yes
orient_ligand                                                yes
flexible_ligand                                              yes
use_internal_energy                                          yes
minimize_ligand                                              yes
num_scored_conformers                                        10
This flexible ligand protocol can be used with multiple ligand input files. The docked ligand poses can be compared using RMSD (Root mean squared Deviation). RMSD is a measurement of the distance between atoms on the original crystal structure ligand with the newly generated ligand conformation. An RMSD under 2 Angstroms would indicate a good conformation. Below are two examples of a final docked ligand in the receptor active site pocket. The worst and best energy scored ligands are shown below. The original ligand is in cyan and the docked ligand is colored in heteroatom.
VI. Virtual Screening
Virtual Screening Introduction
A virtual screen of various ligand allows for the comparison of both qualitative (e.g. position in binding site) and quantitative (e.g. energy scores) data pertaining to the each screened ligand with an originally docked molecule. Virtual screening is often used as a method to cut the cost of experimentation by narrowing down the ligands within a database and predicting which will exhibit the most favorable binding to a specific protein (with a pre-determined .grid file).
Creating a Filter for the Virtual Screen
When first beginning the virtual screen, a filter should be specified in order save computational power by only screening potentially effective ligands within the directory 06.database-filter/. This involves limiting several variables of ligands specified in a .mol2 file. To limit the ligands from the original database, a file dock_filter.in is created. Here are the contents of the file:
ligand_atom_file                                             /home/wjallen/AMS536/multi-mol2-files/cdiv_p0.0.mol2
limit_max_ligands                                            no
skip_molecule                                                no
read_mol_solvation                                           no
calculate_rmsd                                               no
use_database_filter                                          yes
dbfilter_max_heavy_atoms                                     50
dbfilter_min_heavy_atoms                                     0
dbfilter_max_rot_bonds                                       10
dbfilter_min_rot_bonds                                       0
dbfilter_max_molwt                                           9999.0
dbfilter_min_molwt                                           0.0
dbfilter_max_formal_charge                                   -1.0
dbfilter_min_formal_charge                                   -2.0
orient_ligand                                                no
use_internal_energy                                          no
flexible_ligand                                              no
bump_filter                                                  no
score_molecules                                              no
atom_model                                                   all
vdw_defn_file                                                ../00.files/vdw_AMBER_parm99.defn
flex_defn_file                                               ../00.files/flex.defn
flex_drive_file                                              ../00.files/flex_drive.tbl
ligand_outfile_prefix                                        filtered
write_orientations                                           no
num_scored_conformers                                        1
rank_ligands                                                 no
In this file some important characteristics of the ligands that are limited are dbfilter_max_heavy_atoms, dbfilter_max_rot_bonds, dbfilter_max_molwt, and both dbfilter_max_formal_charge and dbfilter_min_formal_charge. As show in the text of the file, a file called filtered_scored.mol2 will be created with all of the ligands from the original database that fit into the specified limits of number of heavy atoms, number of rotatable bonds, molecular weight, and formal charge.
Proceeding to the Virtual Screen
After creating a new directory, 07.virtual-screen/, a dock.in file must be created. So as not to confuse the virtual screen file with the original dock.in of the docked ligand, the new file created is called dock_vs.in. Running this file in dock6 allows us to fill in the important details of the file that terminate in a virtual screening of the input ligand.
ligand_atom_file                                             ../06.database-filter/filtered_scored.mol2
limit_max_ligands                                            no
skip_molecule                                                no
read_mol_solvation                                           no
calculate_rmsd                                               no
use_database_filter                                          no
orient_ligand                                                yes
automated_matching                                           yes
receptor_site_file                                           ../02.surface-sphgen/selected_spheres.sph
max_orientations                                             1000
critical_points                                              no
chemical_matching                                            no
use_ligand_spheres                                           no
use_internal_energy                                          yes
internal_energy_rep_exp                                      12
flexible_ligand                                              yes
user_specified_anchor                                        no
limit_max_anchors                                            no
min_anchor_size                                              5
pruning_use_clustering                                       yes
pruning_max_orients                                          1000
pruning_clustering_cutoff                                    100
pruning_conformer_score_cutoff                               100
use_clash_overlap                                            no
write_growth_tree                                            no
bump_filter                                                  no
score_molecules                                              yes
contact_score_primary                                        no
contact_score_secondary                                      no
grid_score_primary                                           yes
grid_score_secondary                                         no
grid_score_rep_rad_scale                                     1
grid_score_vdw_scale                                         1
grid_score_es_scale                                          1
grid_score_grid_prefix                                       ../03.box-grid/1LOQ.grid
multigrid_score_secondary                                    no
dock3.5_score_secondary                                      no
continuous_score_secondary                                   no
descriptor_score_secondary                                   no
gbsa_zou_score_secondary                                     no
gbsa_hawkins_score_secondary                                 no
SASA_descriptor_score_secondary                              no
amber_score_secondary                                        no
minimize_ligand                                              yes
minimize_anchor                                              yes
minimize_flexible_growth                                     yes
use_advanced_simplex_parameters                              no
simplex_max_cycles                                           1
simplex_score_converge                                       0.1
simplex_cycle_converge                                       1.0
simplex_trans_step                                           1.0
simplex_rot_step                                             0.1
simplex_tors_step                                            10.0
simplex_anchor_max_iterations                                500
simplex_grow_max_iterations                                  500
simplex_grow_tors_premin_iterations                          0
simplex_random_seed                                          0
simplex_restraint_min                                        no
atom_model                                                   all
vdw_defn_file                                                ../00.files/vdw_AMBER_parm99.defn
flex_defn_file                                               ../00.files/flex.defn
flex_drive_file                                              ../00.files/flex_drive.tbl
ligand_outfile_prefix                                        output
write_orientations                                           no
num_scored_conformers                                        1
rank_ligands                                                 no
A few of the questions addressed in the terminal window while running a virtual screen are as follows:
ligand_atom_file - here we have specified the new file created after filtering the initial ligand database file
calculate_rmsd - we select the default <no> because calculating the rmsd for roughly 1000 molecules would be a huge computational cost and it would be better to wait until we have selected a handful of strongly bound ligands to calculate the rmsd for
orient_ligand - here we would like to the have the ligand oriented in the binding pocket
receptor_site_file - this is our selected_spheres.sph file from earlier
internal_energy_rep_exp - here we select 12 rather than 9 because using a repulsive exponent of 12 gives us a slightly steeper rising potential as radius between the atoms falls below the optimal distance (sigma)
flexible_ligand - when performing a virtual screen of a random database it is always advisable to set the ligands to flexible
min_anchor_size - ensures that major features on the molecules are used as anchors and not just simple small groups
score_molecules - we always want to score the molecules of a virtual screen in order to determine which are the best fit for the binding pocket
grid_score_primary - we want the grid score to be the primary method of scoring the screened ligands
grid_score_grid_prefix - the input step for the .grid file created earlier
atom_model - we select the all atom model
num_scored_conformers - we only want to produce one scored conformer from each screened ligand because we only want the best conformations
Note that if you are performing a small sample virtual screening it is possible to run it in Mathlab; however, if you are running the virtual screening to a very large scale (i.e. hundreds or thousands of ligands) you will need to use several nodes in Seawulf to produce results in a timely fashion.
Virtual Screen Results
When your virtual screening has run completely and you are ready to analyze the results, open Chimera. In Chimera you can prepare your protein by opening 1LOQ.receptor.noH.pdb and choosing "Actions --> Surface --> show". You may also wish to open up the original ligand file 1LOQ.ligand.mol2 in order to show the position of the original ligand/substrate in the receptor's active site.
To view the results of your virtual screening go to Tools --> Surface/Binding Analysis --> ViewDock and from their you can select your virtual screen output file. In the "ViewDock" pop-up window you can then select Column --> Show --> Grid Score which will add a column to the ViewDock window with the grid score of each ligand. You can double-click on the column heading Grid Score to sort the ligands based on their grid scores.
[Chimera image1] [Chimera image2]
VII. Running DOCK in Serial and in Parallel on Seawulf
The Seawulf Cluster is a 470-processor Linux Cluster capable of highly parallel processing. This parallel processing allows dock virtual screens to be completed in a fraction of the time as a single processor.
If you are docking multiple ligands, you can use more than one processor in parallel mode, but you should never use more processors than you have ligands. Before we can run DOCK on Seawulf, we need to copy the proper files from Herbie to Seawulf. If we CD into the AMS536 folder we can use the following command from the mathlab computer to copy all of the dock-tutorial files
$scp -r /dock-tutorial/ username@herbie.mathlab.sunysb.edu:~/AMS536/
Now we have all of our DOCK preparation files and folders on the seawulf cluster.
Running DOCK in Serial on a Single Processor
Running on a single processor is very similar to running dock on the mathlab comptuer.
If you make a file called qsub.csh with the text:
#!/bin/tcsh
#PBS -l nodes=1:ppn=1
#PBS -l walltime=01:00:00
#PBS -N dock6
#PBS -M user@ic.sunysb.edu
#PBS -j oe
#PBS -o pbs.out

cd /nfs/user03/zfoda/AMS536/dock-tutorial/07.virtscreen
/nfs/user03/wjallen/local/dock6/bin/dock6 -i dock.in -o dock.out
An explanation of the commands:
#!/bin/tcsh                                                 #Execute script with tcsh
#PBS -l nodes=1:ppn=1                                       #Use one node, and one processor per node, so one single processor
#PBS -l walltime=01:00:00                                   #Allow 1 hour for your job run
#PBS -N dock6                                               #Name of your job
#PBS -M user@ic.sunysb.edu                                  #Get an email notifying you when your job is completed
#PBS -j oe                                                  #Combine the output and error streams into a single output file
#PBS -o pbs.out                                             #Name of your output file

cd /nfs/user03/zfoda/AMS536/dock-tutorial/07.virtscreen       #Change to your home directory and folder with dock files
/nfs/user03/wjallen/local/dock6/bin/dock6 -i dock.in -o dock.out #Specifies path to dock executable and provide input and output filenames
To submit the experiment use the command:
qsub qsub.csh
You will have submitted a DOCK experiment to the seawulf queue.
See also PBS commands.
Running DOCK in Parallel using MPI
In order to run DOCK in parallel you have to use a slightly different build of DOCK6 called dock6.mpi. Message passing interface (MPI) is basically a program that allows programs like DOCK to run in parallel.
So, make another file called qsub.vs.csh with the contents:
#!/bin/tcsh
#PBS -l nodes=4:ppn=2
#PBS -l walltime=24:00:00
#PBS -N screen
#PBS -o qsub.log
#PBS -j oe
#PBS -V

cd /nfs/user03/username/AMS536/dock-tutorial/07.virtscreen
mpirun -np 8 /nfs/user03/wjallen/local/dock6/bin/dock6.mpi -i dockvs.in -o dockvs.out
As you can see there are two major changes:
#PBS -l nodes=4:ppn=2 #Use 4 nodes, and 2 processors per node, so 8 processors
Note: since one processor is used to distribute the processes, this will run DOCK as 7 (n-1) parallel processes.
mpirun -np 8 /nfs/user03/wjallen/local/dock6/bin/dock6.mpi -i dockvs.in -o dockvs.out #this line uses mpi to run dock.mpi on multiple processors
And then we can run:
qsub qsub.vs.csh


