Histograms in R
From Rizzo_Lab
Read in your CSV file with headers
data=read.csv("data.csv",header = TRUE)
List of columns headers
> names(data)
[1] "time"                    "d05t"
...
[94] "DGBSA_run"              "DMMGBSA_run"
Attach the header names of the data set
attach(data)
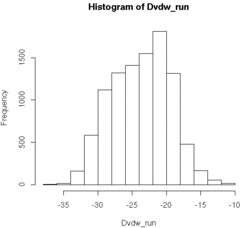
Plot the histogram
hist(DMMGBSA_run)
Plot a single column of data with
plot(DMMGBSA_run)
