File list
This special page shows all uploaded files.
| Date | Name | Thumbnail | Size | Description | Versions |
|---|---|---|---|---|---|
| 09:25, 18 February 2009 | AnnealingRMSD.bmp (file) | 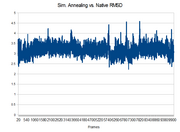 |
1.1 MB | Simulated Annealing of TrpCage vs. Native State (1L2Y) | 1 |
| 09:30, 16 February 2009 | 350KRMSD.bmp (file) | 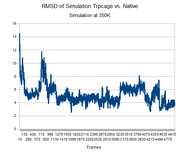 |
719 KB | RMSD plot of the backbone of a simulation of TrpCage at 350K vs. the native state. Native state taken from first model of 1L2Y.pdb. | 1 |
| 09:28, 16 February 2009 | 350KHbond.bmp (file) | 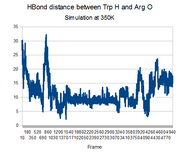 |
719 KB | The Trp H and Arg O interaction in TrpCage. Data from a simulation run at 350K. | 1 |
| 14:42, 14 February 2009 | Trpcagesimhbondgraph.bmp (file) | 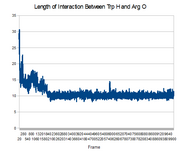 |
719 KB | Graph of distance between Trp H and Arg O in simulation. Note it never achieves appropriate H-Bond distance. It is 1.87A in the native structure. | 1 |
| 14:40, 14 February 2009 | Trpcagesimhbond.bmp (file) | 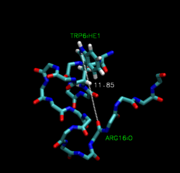 |
692 KB | Reverted to earlier revision | 3 |
| 11:11, 14 February 2009 | Trpcagenativehbond.bmp (file) | 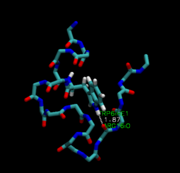 |
692 KB | The trpcage native structure with the hbond between TRP and the ARG oxygen labeled. | 1 |
| 10:48, 14 February 2009 | Trpcagecomparison.bmp (file) | 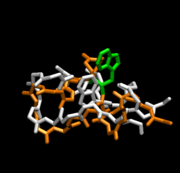 |
692 KB | Comparison of native trpcage (white) vs. simulation trpcage (orange) with the TRP residue highlighted in green | 3 |
| 10:27, 14 February 2009 | Trpcagermsd.bmp (file) | 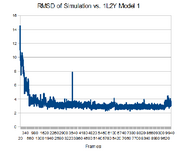 |
719 KB | RMSD of trpcage simulation vs. 1st model in 1L2Y | 1 |